

개요
오늘은 endlessh-go라는 오픈소스를 사용해서
허니팟을 구성하고 또 해커들의 공격 로그를 그라파나 대시보드로 시각화해보려고 합니다.
Endlessh가 뭔가요?
endlessh는 SSH 연결을 시도하는 클라이언트(해커)에게 무한한 배너를 보내는 프로그램입니다.
무한한 배너를 보내서 관리자가 얻는 이점이 뭐냐구요?
악의적인 접속 시도를 하는 해커들의 시간을 낭비시켜주는 것이죠!
그 외에 서버로 들어오는 SSH 공격 시도 감소 라던지, 침임자들의 공격 루트에 대한 보안 로그 수집 및 분석 이라던지 ..
무엇보다도 해커들을 놀려주는게 재밌을 것 같지 않나요?
그럼 이제부터 endlessh-go를 설치해보겠습니다.
Endlessh 설치하기
사전 준비
endlessh-go를 설치하기 이전에 먼저 서버에 prometheus, grafana를 구동시켜주세요.
endlessh-go에는 Exporter가 자체적으로 설치되어 Prometheus에서 해당 익스포터를 수집시켜주도록 설정만 해주면 됩니다.
그라파나에서는 프로메테우스 연동한 후 대시보드 연동해주면 되구요.
또 2222번 포트에 대해서 포트포워딩도 진행해주셔야 합니다!
1. 소스코드 Clone 해오기.
설치는 매우 간단합니다.
endlessh-go 프로젝트를 Clone하여 endlessh를 도커 명령어로 배포해주기만 하면 됩니다.
아래 명령을 실행해주세요.
docker run -d -p 2222:2222 -p 2112:2112 shizunge/endlessh-go -logtostderr -v=1전 도커 컴포즈로 프로젝트를 관리하는 걸 좋아하기 때문에 도커 컴포즈를 사용하시는 분들은 아래 .yml을 참고해주세요.
services:
  honeypot:
    image: shizunge/endlessh-go
    restart: always
    ports: ["2222:2222", "2112:2112"]
    command: ["-logtostderr", "-v=1", "-enable_prometheus"]
    networks: ["monitoring-net"]

networks:
  monitoring-net:
    external: true
    name: monitoring-network
저는 현재 운영 중인 서버에 모니터링 컨테이너들만 따로 모아서 관리하는 도커 네트워크(monitoring-network)가 있기 때문에 해당 네트워크로 honeypot 컨테이너가 편입될 수 있도록 설정하였습니다.
또한 endlessh-go는 기본적으로 메트릭 수집이 꺼져있기 때문에 -enable_prometheus를 comamnd에 추가하였습니다.
.yml 작성이 끝났으면 도커 컴포즈를 실행해줄게요.
docker compose up -d2. Prometheus 메트릭 연동하기
컨테이너 생성이 정상적으로 완료되었다면, 프로메테우스에 endlessh-go 컨테이너의 exporter를 연동시켜주겠습니다.
endlessh-go 에서는 2112 포트 진입점에 /metrics 경로에서 메트릭 수집이 가능합니다.
prometheus.yml 파일에 다음과 같이 위 익스포터를 추가해주세요.
global:
  # ... 이전 설정들
scrape_configs:
  - job_name: "monitoring-item"
    # 관련 설정들 ...
    static_configs:
      - targets: [#..., "honeypot:2112"]
        labels:
service: "monitor"2222번 포트롤 오픈한 지 한 10분 정도 지나니 슬슬 접근 시도가 들어오는데요
/metrics에서 메트릭이 수집되는지 한 번 점검해봅시다.
# HELP endlessh_client_closed_count_total Total number of clients that stopped connecting to this host.
# TYPE endlessh_client_closed_count_total counter
endlessh_client_closed_count_total{local_port="2222"} 2
# HELP endlessh_client_open_count Number of connections of clients.
# TYPE endlessh_client_open_count counter
endlessh_client_open_count{country="Geohash off",geohash="s000",ip="x.x.x.x",local_port="2222",location="Geohash off"} 2
# HELP endlessh_client_open_count_total Total number of clients that tried to connect to this host.
# TYPE endlessh_client_open_count_total counter
endlessh_client_open_count_total{local_port="2222"} 2
# HELP endlessh_client_trapped_time_seconds Seconds a client spends on endlessh.
# TYPE endlessh_client_trapped_time_seconds counter
endlessh_client_trapped_time_seconds{ip="x.x.x.x",local_port="2222"} 275.046
# HELP endlessh_sent_bytes_total Total bytes sent to clients that tried to connect to this host.
# TYPE endlessh_sent_bytes_total counter
endlessh_sent_bytes_total{local_port="2222"} 4099
# HELP endlessh_trapped_time_seconds_total Total seconds clients spent on endlessh.
# TYPE endlessh_trapped_time_seconds_total counter
endlessh_trapped_time_seconds_total{local_port="2222"} 275.0462222번 포트를 오픈한 지 10분도 안되었는데 벌써 접근 시도가 보이고 있습니다 .. ^^
3. Grafana로 시각화하기
이제 메트릭 수집도 되고 있고
이걸 그라파나 대시보드로 이쁘게 시각화하여 모니터링만 해주면 되겠네요!
제가 사용할 대시보드 ID는 15156입니다.
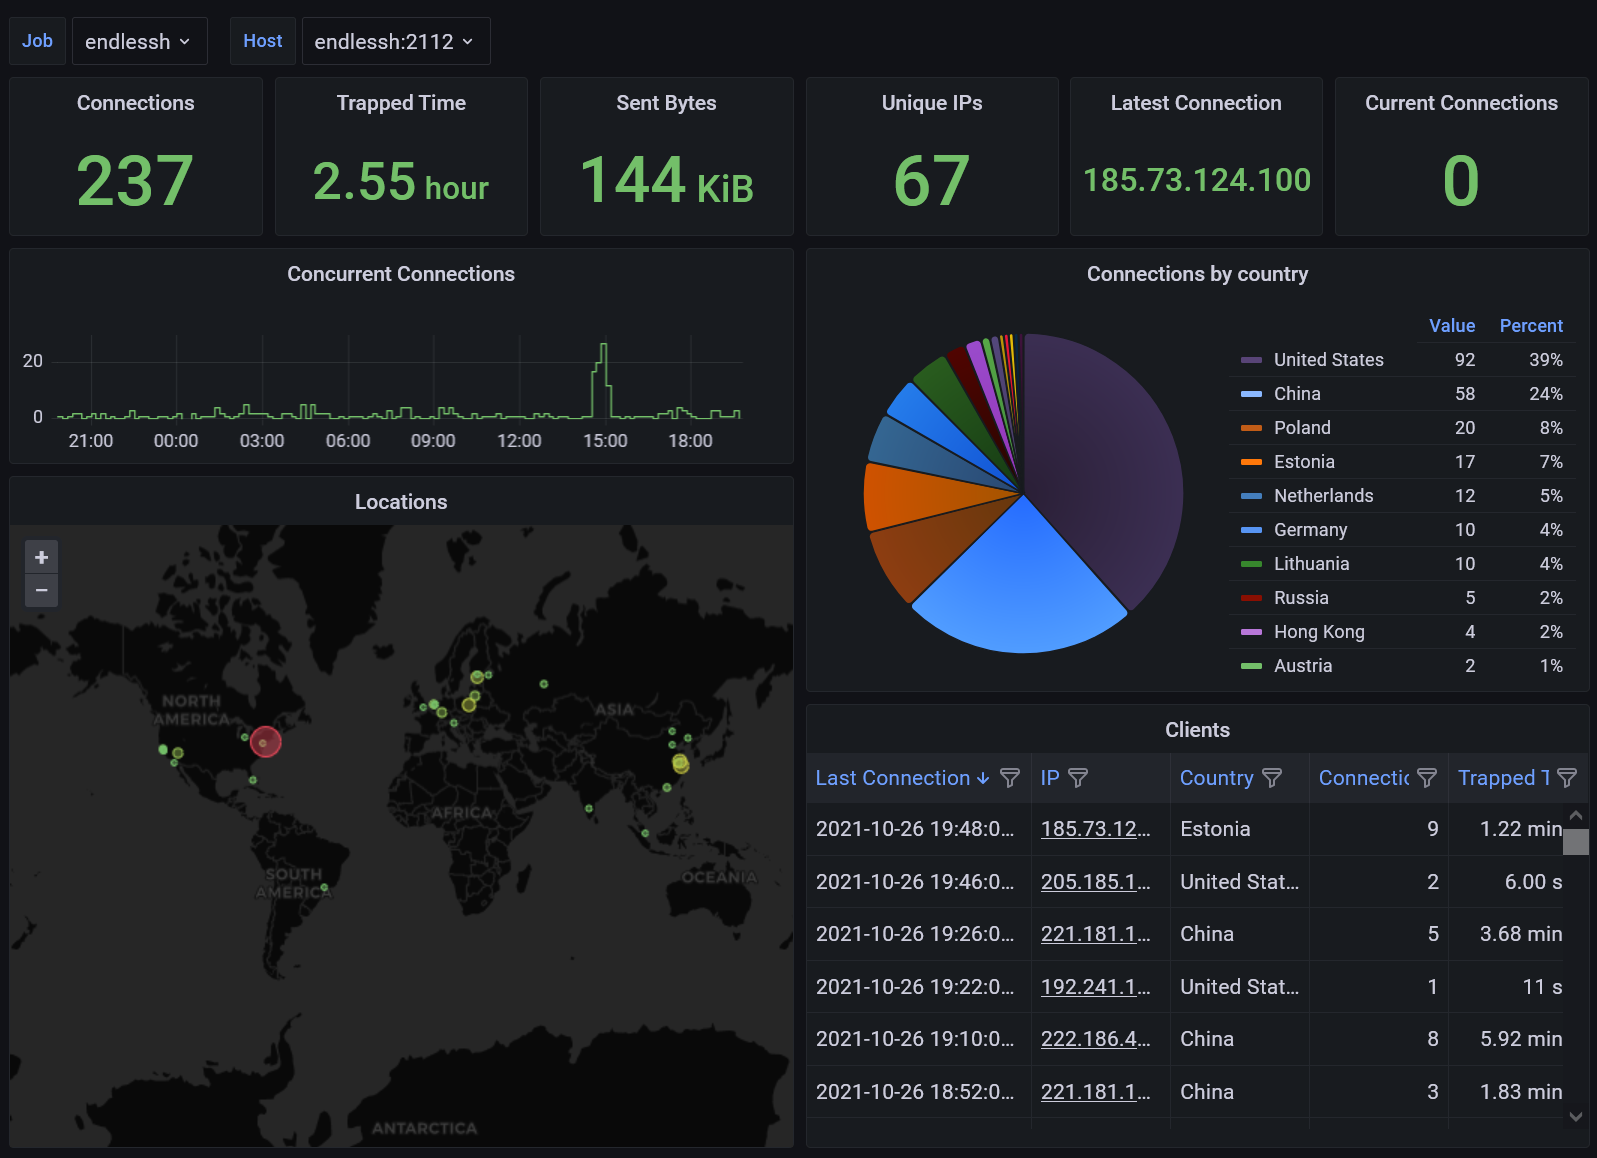
간략하고 깔끔하게 보기 좋아서 이 대시보드를 선택했어요.
그라파나 대시보드에서 위 대시보드 ID를 임포트해주면 끝입니다!